Operations-heavy companies
Sounds like you if
Daily operations run across many people and places, and nobody sees it all at once.
Live visibility across operations in one system.
Live KPIs, staff, projects and finance in one place, so nobody waits for the month-end spreadsheet.
Today
128
▲ 6%
Staff on shift
24
Open items
9
Activity
By department
When decisions depend on numbers that arrive too late.
Sounds like you if
Daily operations run across many people and places, and nobody sees it all at once.
Live visibility across operations in one system.
Sounds like you if
You get the numbers once a month, and by then it's too late to act on them.
One screen for the numbers that matter, updated live.
Sounds like you if
Rosters, attendance and projects live in spreadsheets that break as headcount grows.
Internal tools that scale with your team.

When data lives in separate spreadsheets, the numbers arrive late, disagree with each other and take hours to compile.
Leadership sees performance only when someone finishes the month-end compilation.
Live KPIs updated as work happens, not after it.
Records, rosters and reports live in separate files that never quite match.
One system of record for operations, staff and reporting.
Someone exports, cleans and formats the same data every week.
Automated reports generated on schedule and on demand.
Shared files expose sensitive data, or lock people out of what they need.
Role-based views so each person sees exactly their part.
Data flows in as work happens, and every person sees the part they need.
Pulls from your software, databases and team input continuously.
Staff log attendance, updates and records in the same system.
Totals, trends and targets update without anyone compiling them.
Directors drill from a company total to a branch or a single record.
Scheduled reports land in inboxes, ready for the meeting.
Purpose-built for how your organization actually works.
The KPIs that matter on one screen, updated live from the systems your teams already use.
Staff records, scheduling, attendance and leave in one place, with approvals.
Projects, tasks, deadlines and status reports without chasing updates by email.
Revenue, costs and earnings by period, branch or product, with exports for accounting.
Records and workflows like patient files or inventory, with access defined per role.
Live work from our portfolio, with the results its owners have shared.
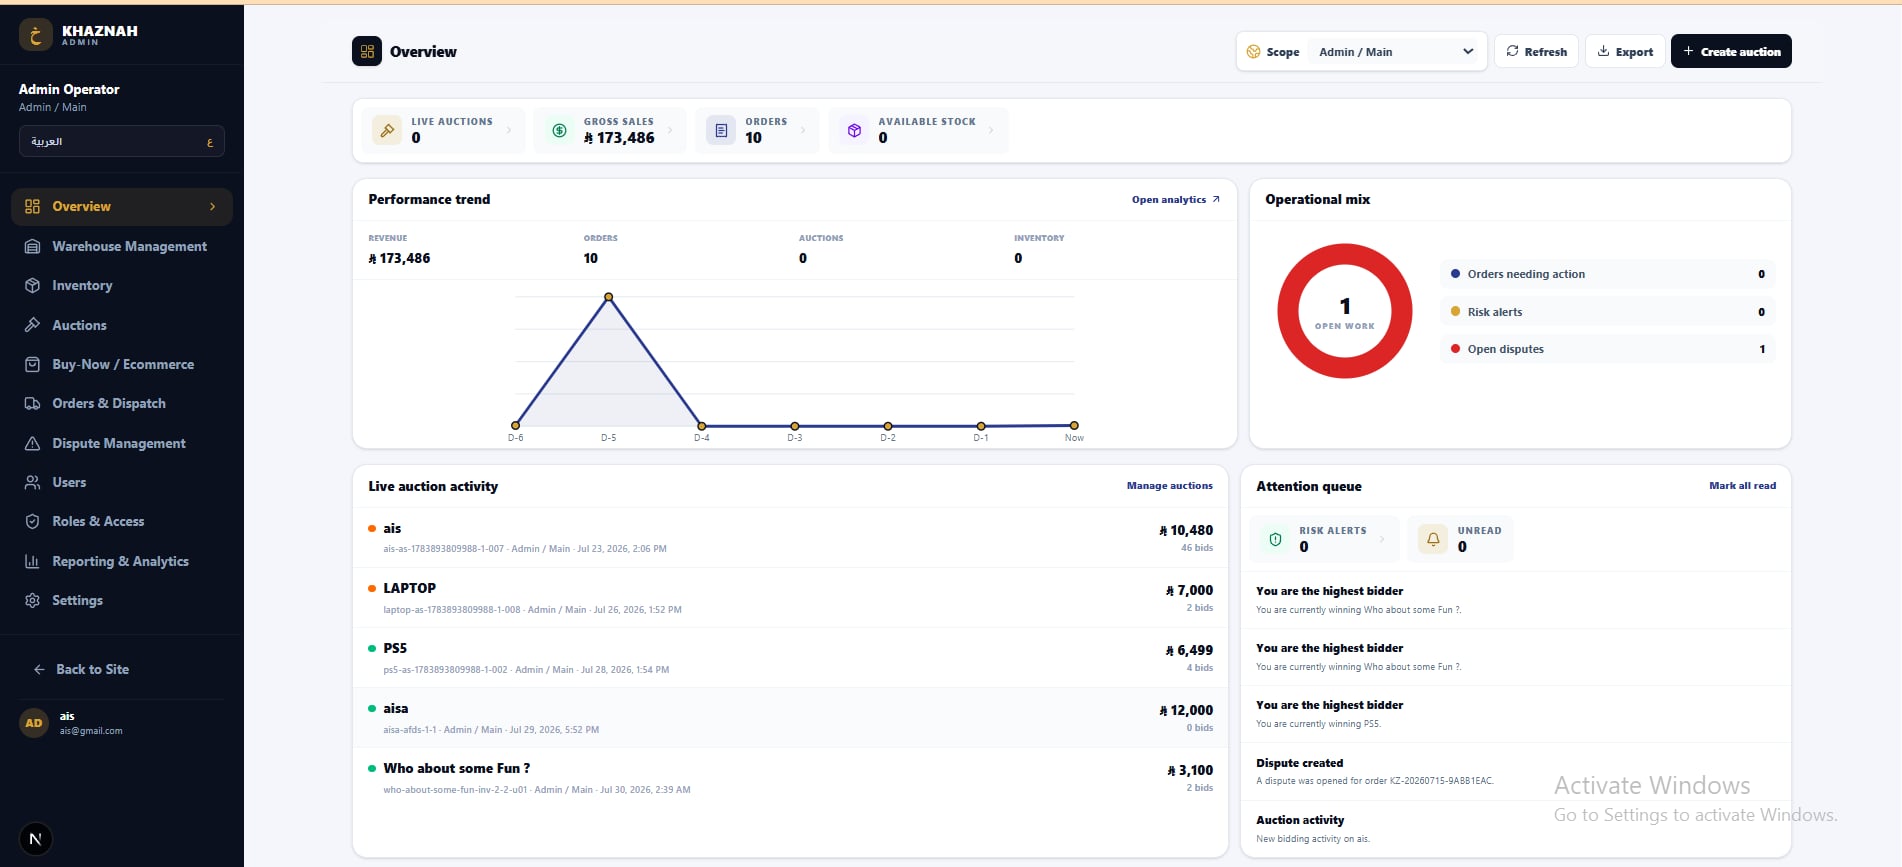
Khaznah Admin · Operations dashboard
A marketplace and live-auction platform — realtime bidding, vendor shops and escrow-style flows.
More results from related projects

What makes an internal tool something people actually open every morning.
Numbers update as work happens, straight from the source systems.
Directors, managers and staff each see their own view and data.
Scheduled and on-demand reports, exported to PDF or spreadsheet.
Connected to your existing software, databases and spreadsheets.
Go from a company total to a branch, team or single record.
Usable on a phone for quick checks, built for desktop for deep work.
Dashboards are scoped around the decisions they support and where the data comes from.
We start with discovery to agree on the decisions and KPIs that matter, design the views, then build with a working demo every week. Data connections usually come first, so the numbers are real from the first demo.
~8weeks
to a typical first release
Fast interfaces on a reliable data layer.
On data sources, access control and replacing spreadsheets.
Still deciding?
Ask us about your project directly.
A free 30-minute call, and a written proposal before any work starts.
BI tools are great for analysts exploring data. A custom dashboard fits when people need to act on the data too: approve leave, update records, assign work. It combines reporting and operations in one tool.
Usually, yes. We connect to existing databases, software with APIs and spreadsheets. Where there is no clean source yet, we build the records system as part of the project.
Yes. Role-based access is built in, so directors, managers and staff each see the views and records that apply to them.
It depends on the data sources, the number of roles and views, and whether the tool also manages records. We scope it on a free 30-minute call and send a written proposal before any work starts.
That is usually the goal. For JG Healthcare, patient records, staff and reporting moved into one system and manual report compilation dropped by about 90%.
Yes. Dashboards are built as one system, so new modules, reports and integrations plug into the same foundation.
Yes. We are based in Bangladesh and work remotely with clients in the United States, Singapore, Saudi Arabia and Oman, with a working demo every week of the build.
Tell us what you're building. We'll scope it around your goals, not a package.


